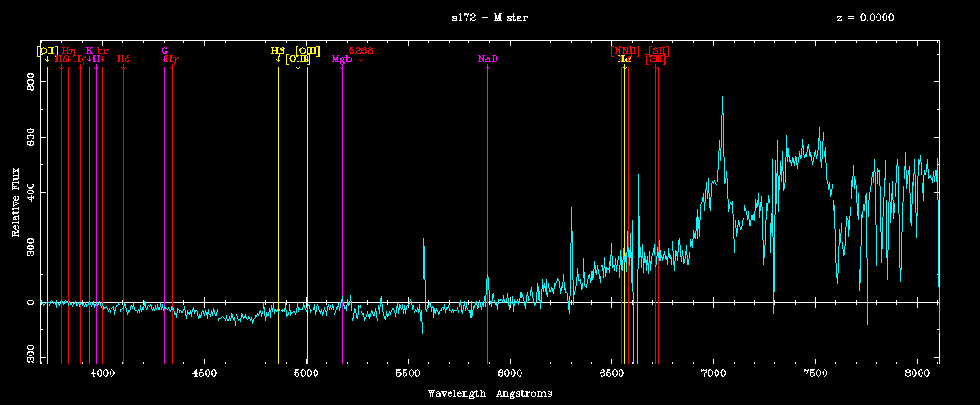
A selection of spectra recorded by the 2df

[<] 1 of 20 [>]
The plots presented here are the reduced from the data recorded on the CCD image.
The selection has been ordered by increasing red shift (z)
The initial spectrum is that of an M type star (Red Dwarf) in the Milky Way galaxy.
The remaining spectra are of external galaxies at various distances.
Notice the spectral feature lines moving to longer wavelengths as the red shift increases.
Source: AAO 2df
- The positions of common spectral features are indicated at the measured redshift of the spectrum, though not all features are necessarily seen in all spectra.
- The raw recorded spectrum is shown in blue. The green spectrum, when given, is a smoothed version. Smoothing the instrumentral response allows weak absorption features to be more easily picked out.
- These sky-subtracted spectra are in raw counts and have not been flux calibrated.
- As with many fibre spectra, residual sky features due to non-perfect subtraction are still seen at the locations of strong airglow lines - these occur at wavelengths of 5577, 5892, 6300, 6363 and > 6800 Angstroms. There is also a bad column on the CCD which affects the spectra near 6600 Angstroms.