The first step in obtaining a light curve of a comet is to obtain a series of estimates of the comet's brightness, the integrated brightness of the comet's head or coma. For relatively bright comets like Hale-Bopp, these estimates are typically made by (amateur) visual observers, who compare the comet's head to defocused stars of known brightness. The stars are defocused because the comet's head has size whereas, the stars are points of light. An observer defocuses the stars until they match the size of the comet's head. Then the relative brightness of the comet is determined by comparing the comet's brightness with the defocused comparison stars. The result is a magnitude estimate of the comet, the observed magnitude. [The brightness of stars is also expressed in magnitudes. The smaller the magnitude, the brighter the object. The brightest star in the sky, Sirius, is magnitude -1.5. Polaris, the pole star is about magnitude 2. Jupiter is about -2, and the faintest stars that can typically be seen with the naked eye (in very dark skies away from the city) are roughly magnitude 6-7. In contrast, the full Moon is about magnitude -13 and the Sun is approximately -26! A one magnitude change amounts to a factor of 2.5 in brightness. A five magnitude change is a factor of 100 in brightness.
A comet's brightness variation with respect to its distance from the Sun is often represented by a "power-law" formula:
where delta is the Earth-comet (geocentric) distance in astronomical units (AU), r is the Sun-comet (heliocentric) distance in AU and n is the "power-law exponent." One AU is equal to the Earth-Sun distance - about 93 million miles or 150 million kilometers. In this equation:
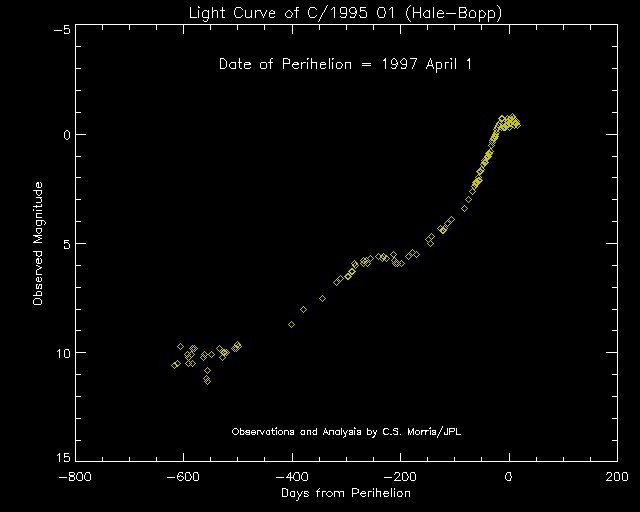
The plot shown below illustrates the variation in the observed brightness of this comet from 1995 July 24 UT (the day after the discovery) to 1997 April 17 UT. This light curve is based on 143 observations made by the author. The during the period of no observations (1995 Novemeber 19 - 1996 February 24), the comet was in conjunction with (or near) the Sun and thus, not visible.
The figure shows the observed magnitude (vertical axis - brightness increases going up the axis) as a function of the time in days from perihelion (the comet's closest approach to the Sun) on the horizontal axis. The days from perihelion are negative prior to perihelion and positive after perihelion.
Each yellow diamond represents the comet's estimated magnitude on one night. Magnitude estimates are given to 0.1 magnitudes. The estimated accuracy of each of these estimates is typically plus or minus 0.1 magnitude. Thus, changes greater that 0.2 magnitude are likely to be real variations in the comet's brightness.
Initially, the comet was quite variable in brightness. However, after conjunction with the Sun, the wild variations in brightness ceased and a steady increase in brightness was observed. This increase was followed by a period of relative constant brightness (from the beginning of July 1996 to present). Part of this slow down in brightening was due to the fact that the Earth's motion in it's orbit was actually taking the Earth away from the comet a few months. However, the comet's intrinsic brightness also wasn't brightening as fast as expected.
Starting in early September 1996, the comet resumed brightening at a normal rate. While this type of behavior is always possible, it is extremely unusual for a comet to increase its rate of brightening as the comet approaches the Sun. In fact, this is the only case like this I have seen in 25 years of analyzing comet light curves.

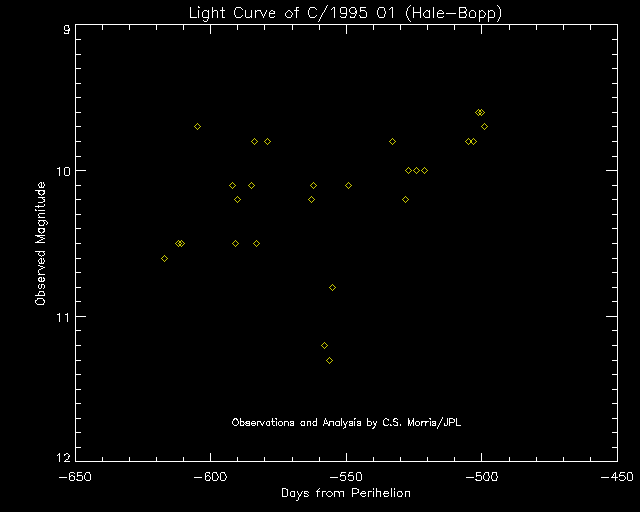
Detail for the early (pre-conjunction) portion of the comet's apparition is shown in the next plot. This illustrates the variation in the observed brightness of this comet from 1995 July 24 UT to 1995 November 19 UT. This light curve is based on 27 observations made by the author.
The plot shows that this comet was quite variable in brightness. This was primarily due to the activity of one major jet. There appear to be peaks in the comet's brightness around -604, -584, and -578 days. The comet also had a significant fading around -557 days. Comets can vary in brightness on short time scales. However, Hale-Bopp varied much more than the average comet during this period. During the last two months of observation, the comet's brightness fluctuations began to settled down.

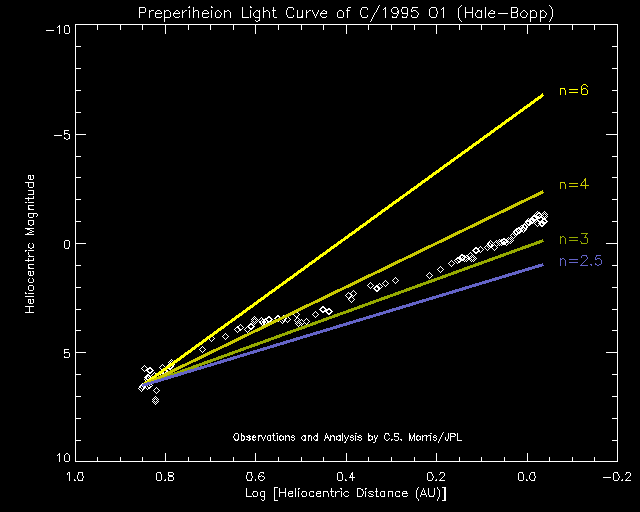
In the third plot, the effect of the changing Earth-comet distance has been removed so that the intrinsic brightness of the comet can be studied. This intrinsic brightness is called the heliocentric magnitude. This is plotted against the log of the heliocentric distance of the comet (r). On this type of plot, the slope of a straight line is equal to (2.5 n) and the absolute magnitude is equal to the the heliocentric magnitude at log (r) = 0, which is to say when r=1 AU. For example look at the blue line. This line assumes n=2.5. The absolute magnitude is about 1.
The diamonds indicate the preperihelion observations on the first plot. Each of the solid lines indicates a possible value of n for the comet's magnitude formula. The lines extend to perihelion. At perihelion, the difference between n=2.5 and n=6 amounts to an eight magnitude range (or a factor of 1500 in brightness). The early data, prior to conjunction with the Sun, suggested a very rapid brightening of n~6. If this trend was to be maintained into perihelion, the comet would indeed become a brilliant object - as bright or brighter than Venus. Don't get your hopes up just yet. As is obvious from this figure, the 1996-97 observations show that the rate of brightening slowed down rather dramatically. In fact the slow down was so dramatic at one point that it was felt that that the comet might only be an average naked eye object. However, the comet rebounded and increased in brightness at a rate between n=3 and n=4.

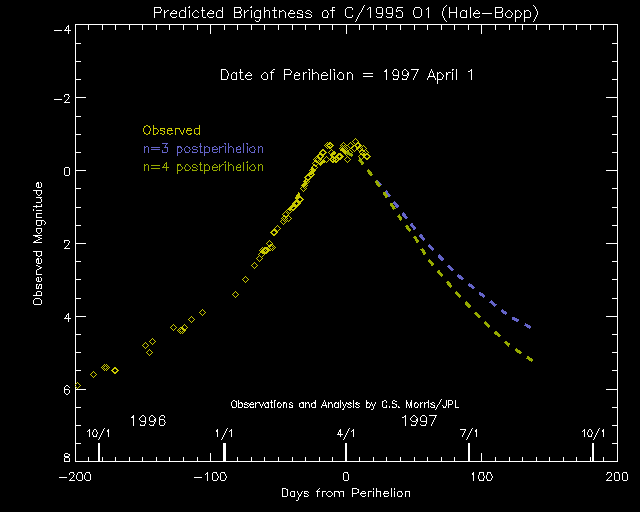
With the comet past perihelion (April 1), it is obvious that the comet has put on a fine show. It is currently running a bit ahead of the prediction I gave several weeks ago. That prediction gave a peak brightness of about -0.6. The peak brightness was actually around -0.7 or -0.8. [I should note that a number of observers have indicated that the peak brightness of the comet was -1.0 or even -1.5. Having observed the comet on nearly every day in March and April from good to superb observing sites, I do not believe that the comet reached -1.0.]
A prediction for the postperihelion light curve... The following plot assumes that the comet reaches a peak magnitude of -0.6 just prior to perihelion. The two postperihelion curves shown below indicate how the comet should fade given n=3 and n=4. It should be noted that comets often fade slowly after perihelion so a value of n~3 is a likely bet after perihelion. The comet should still be 2nd magnitude when it leaves the Northern Skies in May.

![]()
 Comet Images
 Return to Comet Observation Home Page
Charles S. Morris / csm@encke.jpl.nasa.gov